
Physics-based HPWH diagnostics and tuning
EnergyAE now offers heat pump water heater (HPWH) diagnostics to improve your system performance with physics-based component-level modelling and in-house expertise.
Why do some heat pumps perform well and others don’t?
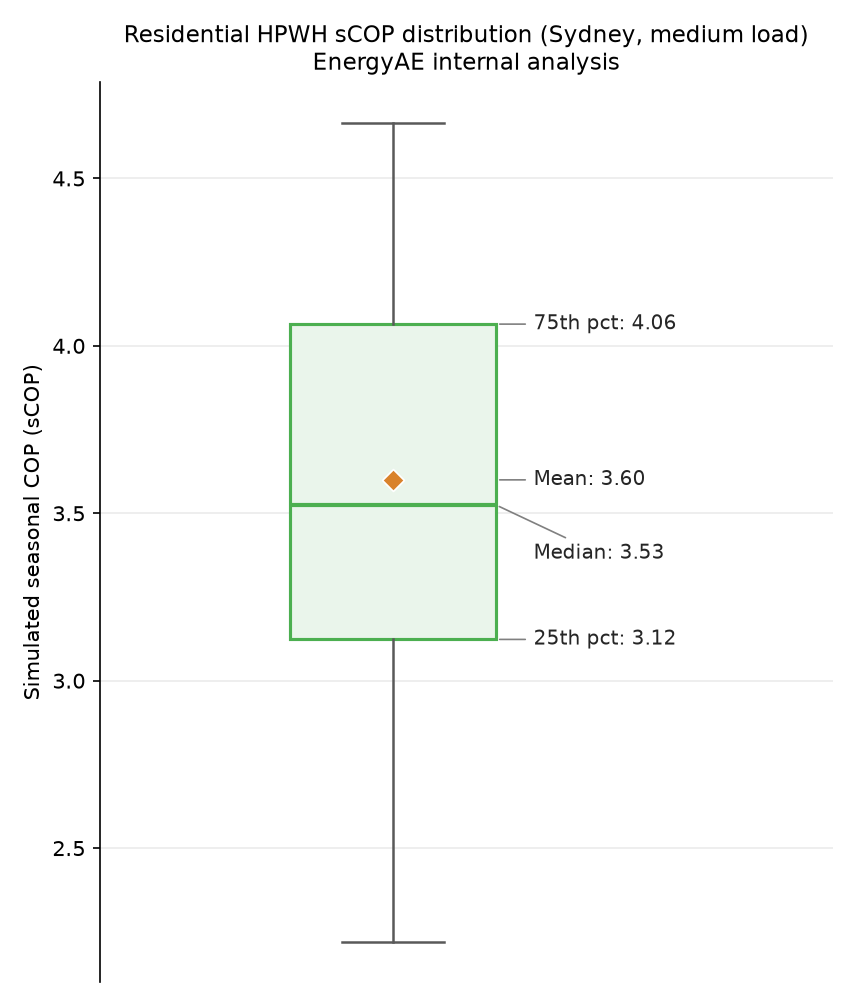
Heat pumps on the market show a wide range of performance: some perform well, others less so – see the figure alongside. So, for some manufacturers, significant performance gains and customer savings are available. However, heat pump design and optimisation is tricky, with highly interdependent components, where system performance can drop due to a range of factors: under-performing compressors, undersized heat exchangers, sub-optimal charge, and control strategy.
“Heat pump design and optimisation is tricky, with highly interdependent components.”
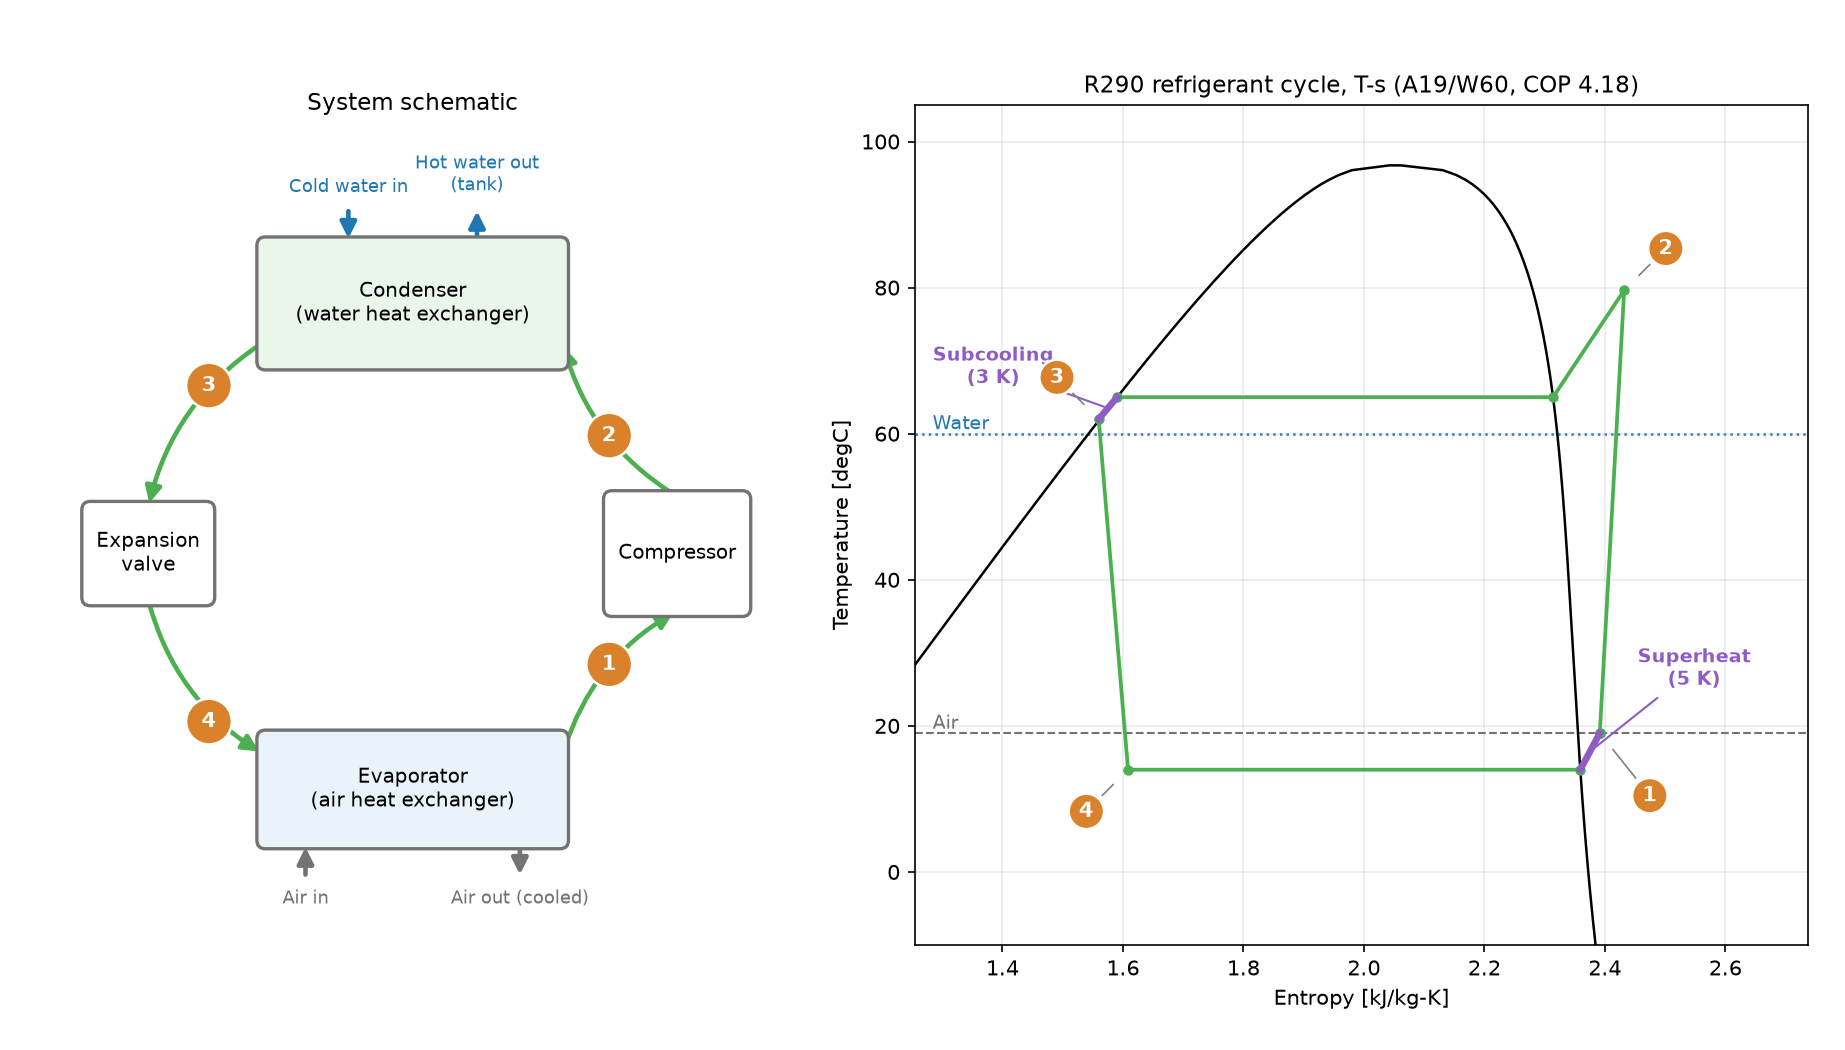
EnergyAE’s physics-based modelling and system diagnostics
EnergyAE can now help you generate detailed insights and optimise your products for each market using our new suite of physics-based modelling tools and in-house expertise. Existing modelling, such as AS/NZS 4234 compliance modelling, uses system testing data (AS/NZS 5125.1) to simulate annual performance. However, performance-increasing insights are limited to control settings, sensor placement and little more – because any change to components would require physical re-testing.
New component-level modelling lets us look inside your system and understand what is driving performance. Explore the simplified vapour-compression cycle viewer below to try it out.
AS/NZS 4234 modelling vs. what component diagnostics tells you
| AS/NZS 4234 modelling | Component-level diagnostics |
|---|---|
| Whole-system annual performance from test data | Where in the system performance is being lost |
| Control settings, sensor placements | Compressor, evaporator, condenser, charge, and control, individually |
| Setpoint temperature effects | Root cause behind a low or inconsistent COP |
| Confirms the certificate outcome | Explains why the outcome is what it is, and what to change |
How we work together
We take your component specifications (compressor, evaporator, condenser, tank), control regime (EEV, frequency map), and testing data to build physics-based models to represent your system. We bench-mark your system performance against ideal performance, indicating where attention is needed. We work with you, advising where extra measurements are most valuable, to understand bottlenecks and increase your performance.
What we need from you
- System schematics
- Component specifications (compressor, evaporator, condenser, tank)
- Control regime (EEV logic, compressor frequency map)
- Testing data (we advise where extra measurement points are most valuable)
We can address:
- Are heat exchangers undersized?
- Is the system over or under-charged?
- Are the control systems tuned optimally? Including temperature setpoints and compressor frequency maps
- How should the tank be sized and the inlets/outlet and heat exchangers arranged?
Apply this to your product
Tell us where you think performance is being lost. We will tell you what we need and how the diagnostic would run.
Explore our vapour-compression cycle viewer
Explore some of the tools we use with our vapour-compression cycle viewer: adjust the operating conditions and see how the cycle, and its performance, respond (best viewed on desktop).