← Back to insights

4 November 2026 — Alastair McDowell

Demand-responsive water heaters and the case for an incentive scheme: the slides

Demand response and demand flexibility were a huge topic at All Energy conference last week in Melbourne. But very little was said about the role water heaters can play in keeping their electrical loads off the grid’s peak periods.

Transmission towers and rooftop solar panels silhouetted against a sunset.
Solar fades and demand rises at sunset. That is when the grid works hardest.

That’s where my talk came in: how demand-responsive water heaters can help reduce peak demand on the electricity grid.
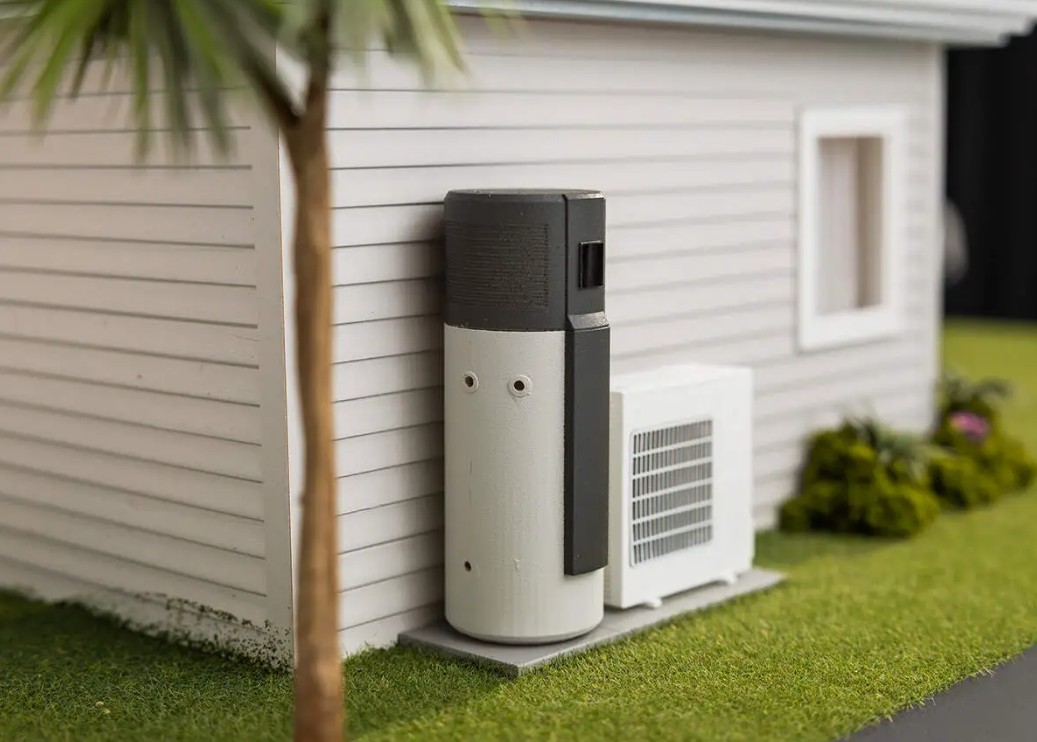
A heat pump water heater beside the outdoor wall of a house.
A heat pump water heater: a thermal battery that most homes already own.

Peak demand and the cost of energy

Australia’s grid is stretched most in the evening. Rooftop solar covers much of the midday load, so demand on the grid dips at noon and climbs after sunset, when the sun is gone and households are cooking, cooling and charging vehicles.

4 6 8 10 12 14 GW 5pm to 8pm 12am 6am 12pm 6pm 12am Summer Autumn Winter Spring
Average demand on the NSW grid after rooftop solar, by hour, 2025. Within 5% of each season's maximum from 5pm to 8pm. Source: AEMO operational demand, market time (AEST).

Wholesale prices follow the same shape. On an average NSW summer day in 2025 the spot price was about $17/MWh in the middle of the day and reached about $207/MWh in the evening. The evening gap is filled by coal, gas, hydro, batteries and imports, and the cost of building and running the plant, batteries and network that serve those few hours is paid for in everyone’s bill.

0 100 200 300 400 500 $/MWh $17/MWh $207/MWh Midday: surplus solar Evening peak 12am 6am 12pm 6pm 12am Summer Autumn Winter Spring
Average NSW spot price by hour of day, 2025. Source: AEMO, market time (AEST).

Emissions

The same pattern drives emissions. At midday a large share of the grid’s supply is wind and solar, and some of it is switched off because there is nobody to use it. In the evening and early morning the supply that replaces solar is more emissions-intensive. 1 kWh used at midday therefore carries lower emissions than the same kWh used at 6pm.

0.0 0.4 0.8 1.2 1.6 Relative to average Average of all hours = 1 Midday: 0.4 1.4 12am 6am 12pm 6pm 12am Year average Summer Winter
Marginal emissions intensity of the NSW grid by hour, averaged over 2027-28 to 2038-39. Source: AER emissions intensity profile for NSW.

A water heater uses energy in proportion to the hot water drawn, and most hot water is drawn in the morning and evening. A heat pump on a thermostat reheats after those draws, so a large part of its electricity falls in the hours when the grid is dearest and dirtiest. It is very efficient, but it is not well timed.

0.00 0.05 0.10 0.15 0.20 0.25 0.30 0.35 0.40 0.45 0.50 0.55 0.60 0.65 0.70 0.75 12am 3am 6am 9am 12pm 3pm 6pm 9pm 12am 50% of its electricity in 25% of the hours Average kW
Average hourly electricity of a water heater on a standard thermostat: half of it in a quarter of the hours. Source: EnergyAE simulation, AS/NZS 4234:2021.

Water heaters as thermal batteries

A 250 to 315 L storage tank holds 10 to 15 kWh of heat. If the heater is allowed to heat in the middle of the day, it can fill the tank from surplus solar, then coast through the evening peak and the next morning’s showers without switching on. The household gets the same hot water at the same temperature. Only the time of heating changes.

250 L stored heat 60°C hot 15°C cold in Heat stored 13 kWh 250 L × 4.19 kJ/kg·K × 45 K ÷ 3,600 Daily shiftable load 13 kWh in the tank 5 to 6 kWh a day moved The tank holds more than the load it needs to shift in a day.
Heat stored in a 250 L tank heated from 15°C to 60°C. A water heater shifts its own hot water load, about 5 to 6 kWh a day.

This works for resistance elements and for heat pumps. It does not need a change in how people use hot water, and it uses the tank, the wiring and the poles and wires that are already installed. A water heater can shift about 5 to 6 kWh a day, which is its own load only, so it complements a home battery rather than competing with it. The battery stays free for the rest of the house.

Storage Home battery, usable 20 to 30 kWh Water heater, 250 L tank (heat) 13 kWh Cost per kWh Home battery: incentive paid $208 Water heater: extra hardware $92
Different cost bases: the battery figure is the incentive paid per kWh of capacity; the water heater figure is the extra hardware cost per kWh shifted a day (RMIT).

Why today’s incentives do not reward water heaters’ time of use

Federal STCs under the SRES, and the state schemes built on the same method, incentivise total energy a product saves over a year, compared to a standard electric water heater. 1 kWh saved at 2am earns the same as one saved at 6pm, because the annual STC calculation has no time-of-day dimension.

0 100 200 300 400 kWh per month Jan Feb Mar Apr May Jun Jul Aug Sep Oct Nov Dec Eref: reference electric water heater, 3,590 kWh a year Edisplaced = Eref − Enew: 2,320 kWh a year Enew: heat pump water heater, 1,270 kWh a year
The certificate counts the annual total. The time of day never enters it. Simplified illustration: EnergyAE simulation, AS/NZS 4234:2021 zone 3, against an electric heater at 97% with no standing losses.

That has a design effect. To maximise certificates means maximising COP: a manufacturer may lower set points and tighten thermostat deadbands to improve the COP of the heat pump’s cycles. While this marginally improves energy efficiency, it also reduces heat stored in the tank, and hot water availability, and limits demand response potential.

0 2 4 6 8 kWh above 45°C 2.9 kWh 55°C 4.4 kWh 60°C 7.3 kWh 70°C 50°C 65°C Thermostat set point
A lower set point lifts heat pump COP and cuts the heat available to carry a peak. Simple energy balance for a 250 L tank at a uniform temperature, counting heat above the 45°C minimum delivery temperature.

Meanwhile, a bigger tank or a fast element, which could be useful features for demand response, adds to modelled energy use under current incentive structures and is therefore disincentivised.

Feature Under today's STC modelling For demand response Lower set point, tighter deadband Higher COP: more certificates Less stored heat to carry a peak Bigger tank More modelled energy use: fewer certificates More stored heat Fast element Adds to modelled energy use: fewer certificates Soaks up surplus power quickly
Features that help demand response are counted as extra energy use, or as lower COP, in annual-energy certificate calculations.

A product that adds demand response hardware can lose certificates and can fail the minimum energy saving, even though the same hardware helps the grid. And because STC modelling must include any default timer and can give it only zero or negative credit, a manufacturer has no reason to set a grid-friendly control strategy as the factory default setting.

Daytime superheat Heat pump heats to 70°C by day Evening: 0.5% Peak block Heat pump blocked 3pm to 9pm Evening: 0.5% Set-point shift Heat pump, lower set point at peak Evening: 25.3% Price threshold Element on below $10/MWh Evening: 22.9% Negative price Element on at negative prices Evening: 24.7% Evening: share of the year's electricity used in the evening peak. Standard thermostat Control strategy Late afternoon and evening
Average hourly electricity over 24 hours (12am to 12am). Blocking the evening clears it. Price-triggered strategies add midday heating when prices allow but do not stop the thermostat reheating in the evening.

What the modelling shows

We simulated 14 water heaters for a full year in TRNSYS: electric tanks, R290 and CO2 heat pumps, in 180 L and 320 L sizes, with and without a 3.6 kW element. Each ran on six control tiers, from a plain thermostat, through a simple timer, to one-way price signals and two-way control that reads the state of the tank.

No link to the heater One-way price signal Two-way: reads the tank T0 Thermostat No demand response T1 Timer Heats 10am to 4pm and 9pm to 7am T2 Low price Element on when the price is low T3 Negative price Element on at $0 or below, or cheap against the DR bank T4 As T3 Weighted by how full the tank is T5 As T3 Weighted by how full the tank is 14 water heaters, each simulated for a full year on every tier Electric tanks, R290 and CO2 heat pumps · 180 L and 320 L · with and without a 3.6 kW element
Control tiers modelled in the white paper. Price thresholds were set per system.

Simulation inputs: in addition to AS/NZS 4234 load profiles and climate data, the simulation uses AEMO spot prices & total grid demand, as well as state-specific emissions intensity profiles, to help understand how altering water heater timing can impact on energy costs, peak demand and grid emissions.

AS/NZS 4234 hot water load and climate AEMO spot prices AEMO total grid demand State emissions intensity profile TRNSYS full-year simulation of the product and its control Wholesale energy cost Demand during grid peaks Grid emissions Delivery at 45°C and legionella control
Inputs and outputs of the water heater simulation.

The results were clear: grid-friendly control strategies can reduce grid emissions by up to 47% and reduce wholesale energy costs by 27 to 44%, all while only consuming 1 to 2% more electricity for solar timers, or 9 to 12% more for 65°C pre-heating, compared with standard thermostat controls.

$0 $100 $200 $300 $400 Wholesale electricity cost, $ a year $426 Thermostat (T0) $311 Demand response (T5) 27% lower Electric tank, 320 L $168 Thermostat (T0) $95 Demand response (T5) 44% lower Heat pump with element, 320 L (4 kW)
Timing cuts the wholesale cost of the same water heater by a quarter to almost half. Source: EnergyAE TRNSYS simulation, 320 L systems, AEMO NSW spot prices capped at $500/MWh, climate zone 4.

These come from separate modelling runs. The cost figures are from the 14-heater NSW study. The emissions and electricity figures are from modelling of a typical 270 L R290 heat pump against an hourly emissions profile.

And the controls still deliver the same hot water ensuring the end user’s comfort, as well as maintaining safety - legionella control is never sacrificed. Every simulation result must ensure minimum delivery 45°C and daily or weekly legionella sanitation is passed.

20 30 40 50 60 70 80 90 Tank temperature, °C 60°C Day 1 Day 2 Day 3 Day 4 Day 5 Top, hot water delivered Middle Lower tank 45°C minimum delivery temperature
TRNSYS 15, 320 L integral R290 heat pump with a 3.6 kW element on demand response control, climate zone 4, five days. Lowest delivered temperature over the full year: 48.6°C.

But households only see the cost savings on a tariff that passes wholesale prices through, which is one of the barriers the scheme is meant to address.

Wholesale spot price set every five minutes Retailer Plans that pass on wholesale prices Few retailers offer one Timing saves the household money Flat or time-of-use tariff Most households Same bill whenever the heater runs The certificate pays for timing where the tariff does not.
Without a tariff that passes on wholesale prices, a household gains nothing from shifting its water heater.

The case for an incentive scheme

The benefits of demand response are well evidenced in theory and in early field trials, and uptake is still minimal. Households do not know it can save them money. Few aggregators can control water heaters at scale, and few tariffs pass on five-minute wholesale prices. Almost nothing rewards a household for deferring a network upgrade, apart from overnight controlled load. And manufacturers have little reason to build smarter controllers when the extra cost is not paid back.

1 Households do not know demand response can save them money 2 Few aggregators can control water heaters at scale 3 Few tariffs pass on five-minute wholesale prices 4 Little rewards a household for deferring a network upgrade, beyond overnight controlled load 5 Smarter controllers add product cost that nothing pays back
Barriers named in the white paper. Benefits are well evidenced in theory and in early field trials, and uptake is still minimal.

Incentives change what the industry builds, and quickly. The Cheaper Home Batteries Program pays about 30% of the price of a home battery through STCs, and installations rose from a few thousand a quarter to more than 500,000 in about 13 months. Water heater installations followed the same pattern wherever a scheme paid for them. Manufacturers and installers respond to what a scheme pays for.

0 20k 40k 60k 80k 100k 120k 140k 160k 86k 121k 125k 141k 2020 2021 2022 2023 2024 2025 2026 Cheaper Home Batteries Program starts 1 July 2025 472,667 in the program's first year 2020 to mid-2025: industry chart, read from image (source to confirm). From July 2025: CER installation data.
More than 500,000 home batteries in about 13 months, paid through STCs in the SRES. Source: CER; 2020 to mid-2025 read from an industry chart.

At the moment no scheme pays for when a water heater runs. A demand response certificate (DRC) would, and it can be calculated the same way as an STC: the electricity a product uses in the hours when the grid has surplus (low prices and low demand), over 10 years, compared with the same heater on a thermostat, and counted only if the household is no worse off. The white paper tested one version of this using spot prices, and the exact design is still being refined.

Today STCs = energy saved over a year × 10 years A demand response certificate Electricity used in the grid's surplus hours × 10 years Compared with the same heater on a thermostat, with the household no worse off Heats in the surplus midday hours Counts Heats through the evening peak Does not count Which hours count is still an open design question.
A timing certificate, calculated like an STC. The white paper tested one version using spot prices.

If the scheme is well designed, the benefits reach beyond the households that buy the products. Lower peak demand defers network and generation spending. More midday load means less solar curtailment. Lower wholesale prices in the evening peak could ultimately help lower energy costs for all consumers.

Households Lower upfront cost for flexible appliances Lower bills on tariffs that reward timing Lower wholesale prices for everyone No change in behaviour required Networks Better use of existing assets Better reliability Faster electrification The grid and generators Lower peak demand and grid stress More midday demand for solar, less curtailment Network upgrades avoided or deferred Retailers and aggregators New retail plans that pass on wholesale prices The critical mass large aggregators need
Benefits of a demand response certificate scheme, by group.

Open design questions

The method is still being refined, and three questions will shape it. Which hours should count: the lowest-price hours, the hours of both low price and low demand, or a fixed daytime window that a simple timer could meet? What should a product be measured against: a standard thermostat, or a reference control for its type? And who funds the certificate, and at what value: a figure tied to the network cost it avoids, as the white paper suggests?

If you work on tariffs, aggregation, controls or scheme design, I would like to hear your view. Get in touch.

The slides

The talk is based on the Demand Response Certificate white paper by Dr Dean Clift and me. Dean works part-time for Rheem Australia, and EnergyAE models water heaters for many manufacturers; no product is promoted. The slides below are from my presentation at All Energy Conference 2026. They show the method as presented on 29 October, and the design is still being refined with industry and regulators.
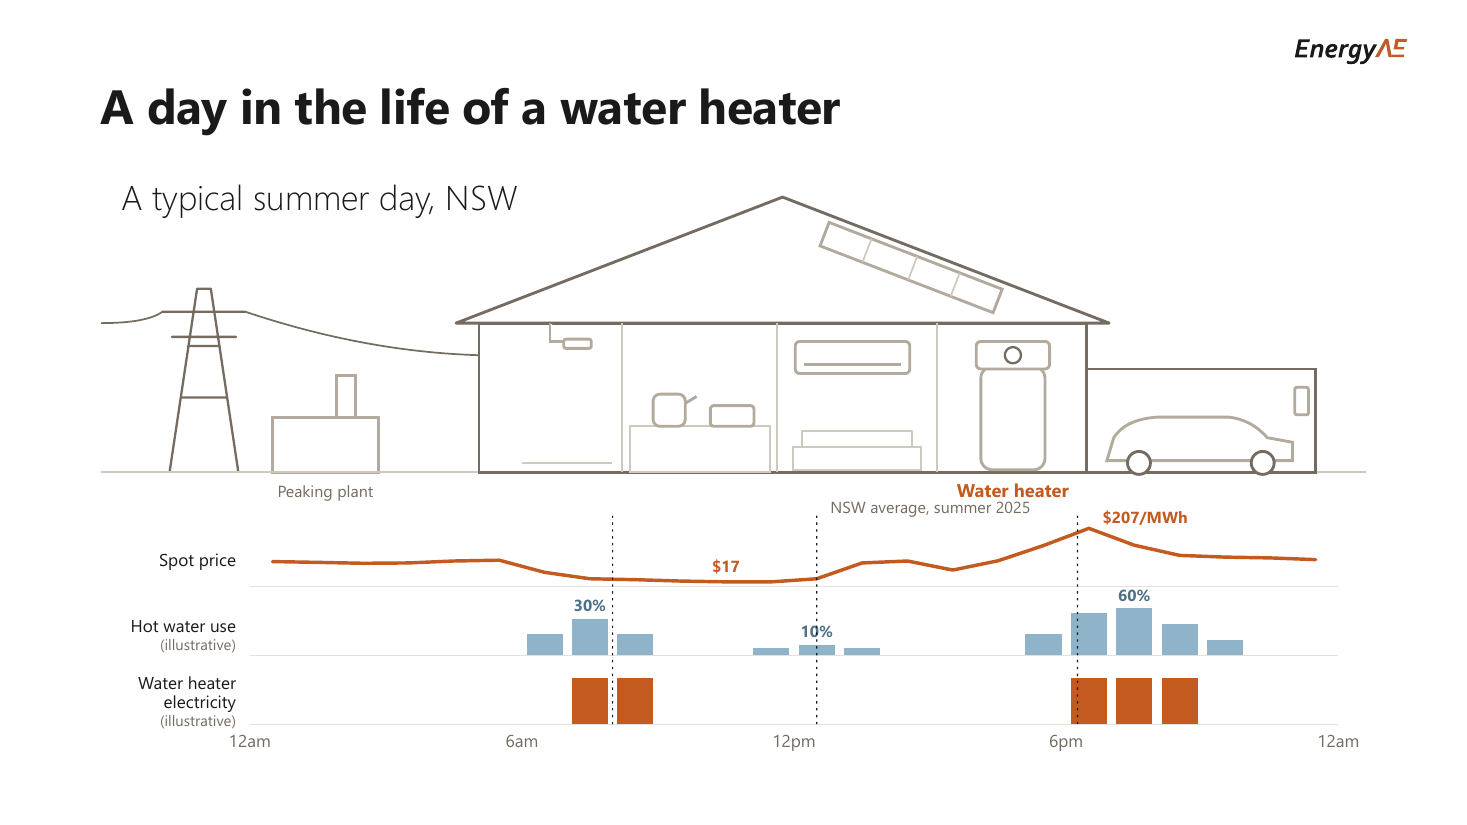
A day in the life of a water heater: the NSW summer spot price, hot water use and water heater electricity across 24 hours, with the heater running in the morning and evening peaks.
The 25 slides as presented at All-Energy Australia on 29 October 2026. Click or use the arrow keys to move through them. A PDF handout is also available.